next up previous contents index
Next: Server Up: Performance Evaluation Previous: Average Queue Length in   Contents   Index


Client-Server System

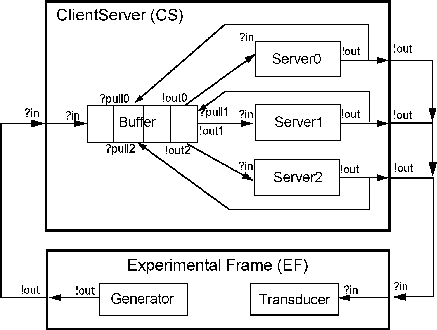
The example Ex_ClientServer shows all features of performance measurement introduced in this chapter. This example considers a configuration of $ n$ servers where $ n$ can vary from 1 to 5. Figure 4.7 illustrates the case of $ n=3$ .

The entire simulation model consists of the client-server system under test, named CS, and the experimental frame, named EF, as shown in Figure 4.7. The sub-components of EF, Generator and Transducer were investigated in the previous section, so we will discuss the sub-models of CS in the following sections.

Figure 4.7: Configuration of Client Server System $ n=3$
\begin{figure}\centering\mbox {\epsfig{file=ClieServ,width=0.8\columnwidth}}
\end{figure}

Figure 4.8: Server and Buffer
\begin{figure}\centering\mbox {\epsfig{file=SrvBfr,width=1.0\columnwidth}}
\end{figure}


Subsections

MHHwang 2007-05-07